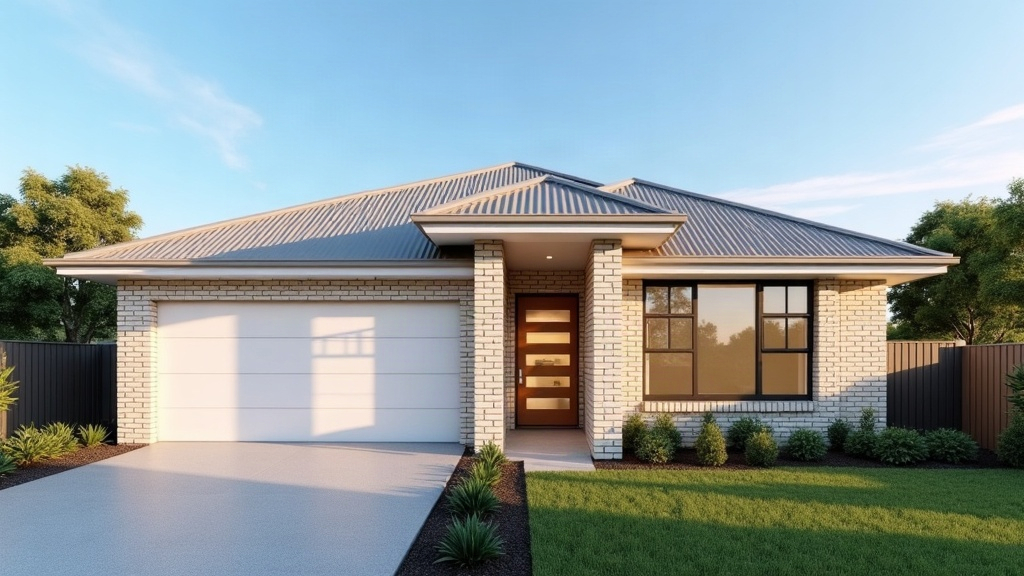

Every few weeks the headline changes but the tune stays the same. Crash. Collapse. The end of the great Australian dream. The Commonwealth Bank recently warned national values could fall by close to 10 percent from peak to trough this cycle, and the panic machine kicked straight into gear.
So let me offer something the six o'clock news rarely does. The actual numbers, and what they mean for you.
The number that stops the collapse story cold
Start with where prices actually are today. As of August 2026, national dwelling values sat just 3.6 percent below their March peak, after five small monthly dips (Cotality). That is the "crash" so far. A soft few months off the top of a very long climb.
Now the bigger claim. A 10 percent fall in national house prices has never happened. Not once. In more than 40 years of records there have been around six national downturns, and the average fall across them was roughly 7.4 percent (CoreLogic data via Betashares). Not one reached 10 percent. So the "worst case" being splashed across the headlines would be the deepest national fall on record. Possible. But framing the outer edge of history as the likely outcome is exactly how a click gets earned.
Even if it happened, it only costs you a year
Here is the part nobody puts in the headline. A 10 percent fall from the current peak would only unwind a little over a year of growth. It would put values back around where they sat in late 2024.
Think about that. The absolute worst case being discussed hands buyers back roughly one year. Meanwhile some markets have been delivering that much in a single year, and doing it again the next. Perth rose about 21 percent in 2024 alone (REIWA). Brisbane and Perth have both strung together back to back double digit years while the southern capitals were flat. Markets cycle at different times, and they always have.
A one year giveback after years of compounding gains is not a collapse. It is a breather.
The story hiding inside the average
Here is what almost no one is talking about, and it is the most important part.
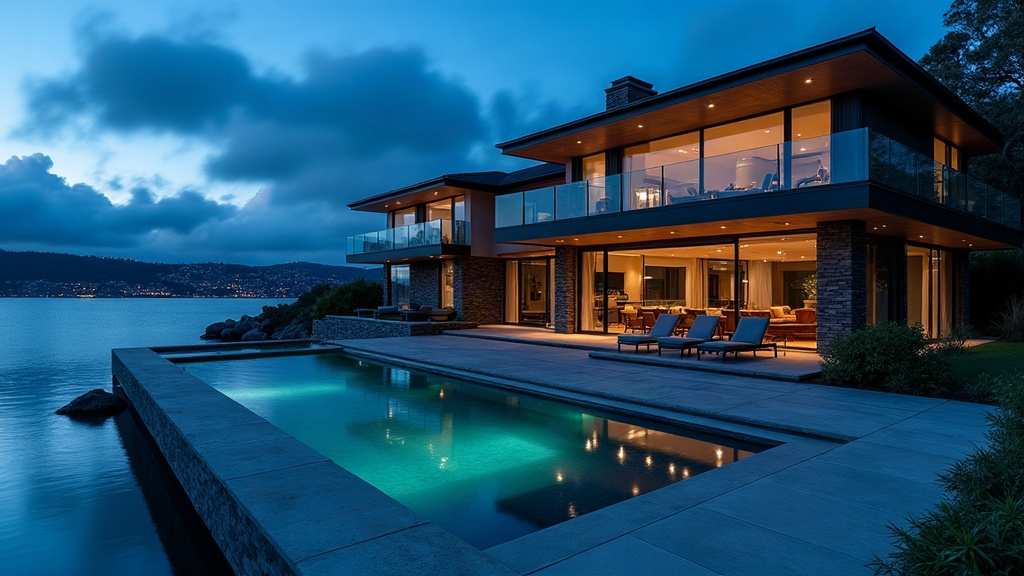
When prices soften because of cost of living pressure and higher interest rates, it is the top of the market that gets hit first and hardest. The multi million dollar suburbs are where the falls are showing up. Upper quartile homes in Sydney and Melbourne are down more than 10 percent from their peaks. The lower quartile, more affordable end is down far less, and plenty of affordable outer suburbs are actually rising (Cotality via ABC News).
Melton, on Melbourne's outer west, is up around 15.6 percent for houses over the past twelve months (htag). Up. During the "collapse."
So when someone quotes a national average falling, remember what an average hides. The prestige end drags the number down while the affordable end quietly keeps climbing. Two completely different markets, reported as one.
So what is really going on? Confidence.
The problem is not the market. It is confidence.
Buyers are sitting on their hands, and who can blame them. They cannot get a clear read on what the government will say or do from one week to the next. Every fresh headline about a crash, or a tax change, or a new policy chips away at the confidence people need to make the biggest decision of their lives. Confidence gets killed by noise, and right now there is a lot of noise.
Doom and gloom is the media's favourite subject for a simple reason. The majority of Australians have their wealth tied up in property, so a scary property headline touches almost every household. That is why it gets the clicks and the talkback calls. But clicks are not data. And the data tells a very different story to the mood.
The real problem isn't the market. It's confidence, and confidence gets killed by misinformation, not by the numbers.
Now look at what is coming
While everyone argues about a possible 10 percent dip, the fundamentals are lining up in the exact opposite direction. More people. Fewer homes.
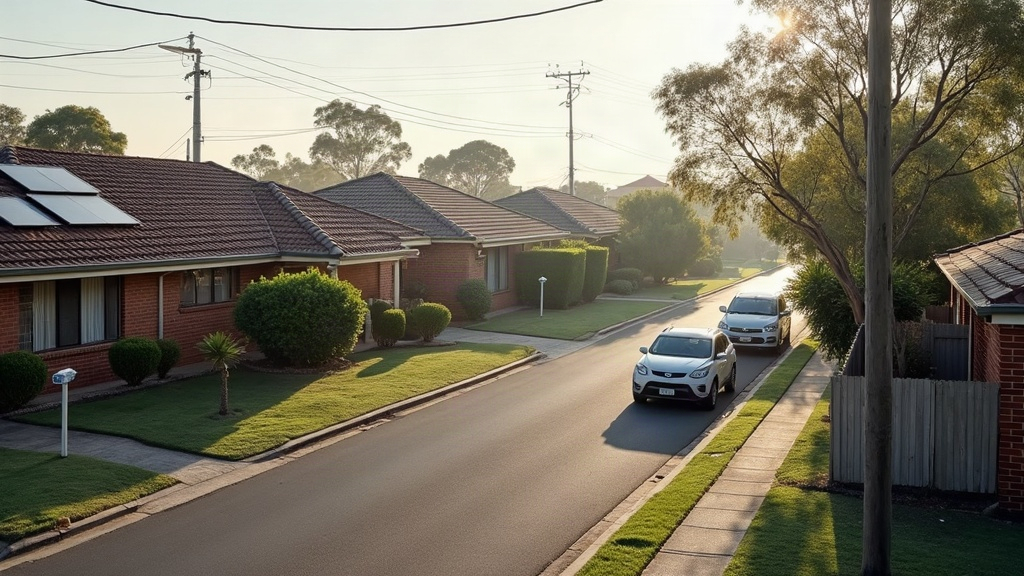
Rents have already risen more than 40 percent nationally over the past five years, and growth has re accelerated to a record cost for tenants (Cotality). Then there is the part most people missed. NAB's economics team warned that because of the government's investor tax changes, gross rental yields may need to climb by 25 to 30 percent to keep landlords in the game if prices stay flat. That is not a number that has already happened. That is the pressure still to come.
More people, less supply, and rents pointed sharply up. It does not take an economist to see where that leads. At some point the maths flips for a huge number of renters, when owning becomes cheaper than renting. When that debate tips, confidence comes roaring back out of pure necessity, and it comes back fast.
The quiet move the smart money is already making
Under all the fear, confidence is still there. In Cotality's latest sentiment survey, 87 percent of Australians expected home values to rise over the year ahead, and only 3.5 percent expected them to fall. The fear is loud, but it is not shared by the majority once you ask them directly.
Which brings me to the only investing rule that has never gone out of date. Warren Buffett put it best.
Be fearful when others are greedy, and greedy when others are fearful.Warren Buffett
Right now, others are fearful. That is precisely the window. The investors who understand how markets actually work are quietly positioning now, while the headlines are ugly and the competition has gone quiet. Because there is a bottleneck coming. When rates ease and confidence returns, everyone piles back in at once, and prices move before the nervous buyers have finished reading the good news headline. The rush that everyone is waiting to join is the rush that prices you out.
The collapse everyone is watching for is the least likely outcome on the board. The real risk is not that prices fall 10 percent. It is that you spent the whole opportunity waiting for a crash that history says does not come, and missed the run that always follows.
Skip the BBQ advice. Look at the data. Then decide.
Common questions
Is the Australian housing market going to collapse in 2026?
Has a 10 percent national house price fall ever happened?
Which parts of the market are actually falling?
Are rents going to keep rising?
Why would prices rise again if they are softening now?
Sources
- Cotality (formerly CoreLogic), Home Value Index, August 2026 (national values 3.6 percent below March peak, five consecutive monthly falls)
- Commonwealth Bank, Housing outlook update, 2026 (peak to trough forecast of around 9 to 10 percent)
- Betashares, "How far could house prices fall", citing CoreLogic data on national downturns since 1980 (six declines, average 7.4 percent)
- REIWA, Perth property market 2023-24 review (Perth annual house price growth around 21 percent in 2024)
- Cotality via ABC News, July 2026 (upper quartile Sydney and Melbourne down more than 10 percent, lower quartile down far less)
- htag.com.au, Melton, VIC 3337 market data 2026 (median house growth around 15.6 percent over 12 months)
- Housing Industry Association, building approvals and supply, July 2026; net migration 489,300 versus 174,500 net new dwellings, year to March 2026
- SQM Research, national residential vacancy rate 2026 (near record low around 0.7 percent)
- Cotality Rental Review, Q1 2026 and June 2026 (rents up 5.9 percent year on year, around 44 percent over five years)
- NAB economics, client note, August 2026 (gross rental yields may need to rise 25 to 30 percent to offset investor tax changes)
- Cotality sentiment survey, 2026 (87 percent of respondents expect values to rise, 3.5 percent expect falls)
- Warren Buffett, Berkshire Hathaway shareholder letter, 1986